1. Which of the scatter plots above shows a negative trend?
A. II
B. III
C. I
D. None of these
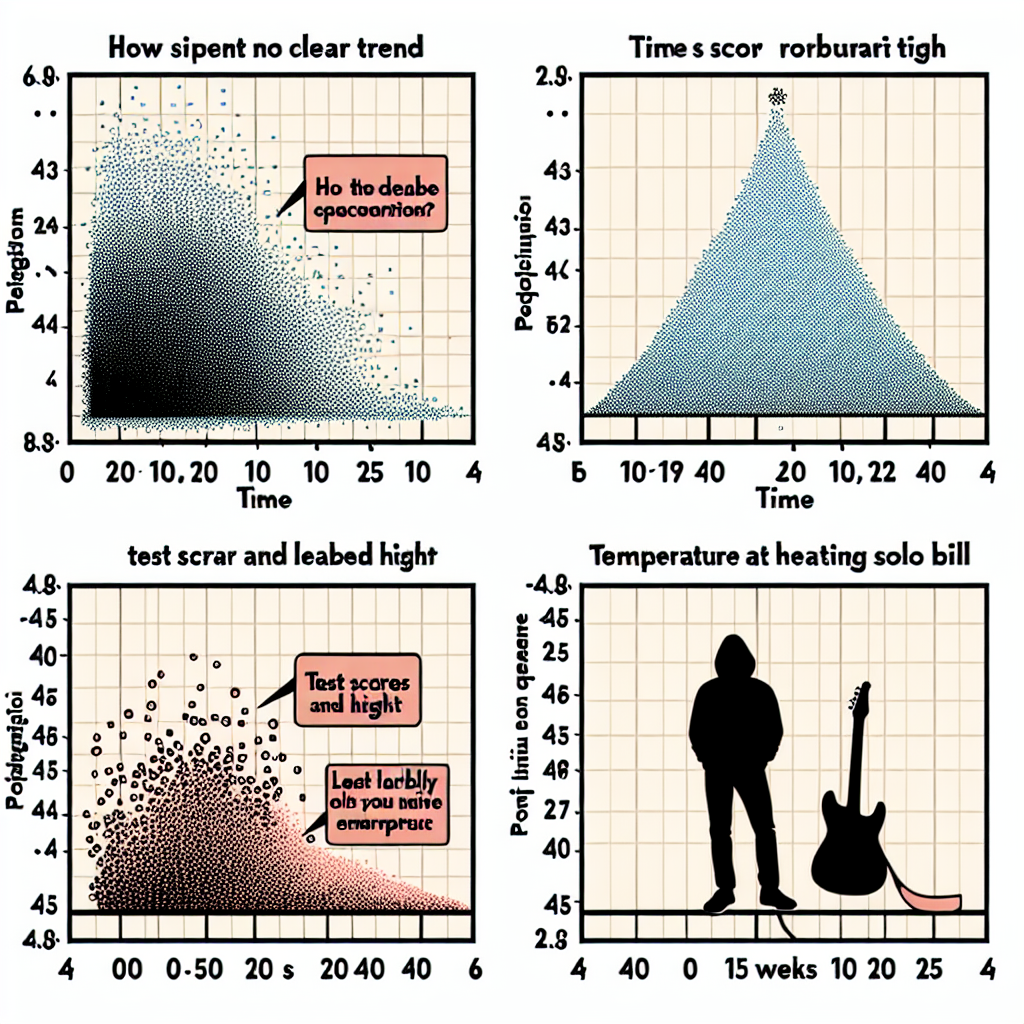
2. The scatter plot below shows the population of a village (p) over time (t). Describe the relationship between the population of the village and time.
A. The population remains roughly the same over time.
B. The population is increasing over time.
C. The population is decreasing over time.
D. None of these.
3. Which of the following examples would show a negative trend?
A. Height abd weight of students.
B. Test scores and height of students.
C. Outside temperature and heating bill.
D. None of these.
4. The scatrer plot below shows the relationship between the time spent learning a piece of music for the guitar and the score at the annual solo competition. Predict the score for 15 weeks of practice.
A. About 61
B. About 41
C. About 29
D. About 56
Please can someone help me, or can you help me solve the problem because I'm confused
Hate connections is WRONG!!!!
1. A Graph II
2. A The population remains roughly the same over time
3. C Outside Temp and heating bill
4. B About 41
That jerk made me get a 50%!!
1.) A
2.) A
3.) C
4.) B
Bonesaw26 is 100% correct!
1. A Graph II
2. A The population remains roughly the same over time
3. C Outside Temp and heating bill
4. B About 41
Thanks Bonesaw , ur the best
1) A
2) A
3) B
It looks like for once we will leave behind a path of answers for new students last year, its an honor after seeing people from so many years ago help me with this grade level... knowing we can help others is so nice
thanks bonesaw
Hello!
I'm IM STUMPED >_< and I have been here for super long and giving out answers! BTW Bonesaw is 100% correct so if you ever get down here, Bonesaw is Correct!
Here are the answers
1. A (II)
2. A (The population remains roughly the same over time)
3. C (outside temperature and heating bill)
4. B (about 41)
This is only for Connexus answers for Pre- Algebra Unit 3 Lesson 6
Hope this helps!
- IM STUMPED >_<